[return to KB Wong's
home page]
A tutorial on using PyMOL to generate publication quality figures.
Through this tutorial, you will be able to generate the following
figures:
You can download the files for the tutorials here.
Files included:
1w2i.pdb - crystal structure of PH acylphosphatase (PDB: 1W2I) (Cheung et al,
Biochemistry, 44:4601-4611.)
2fofc.map.xplor - electron density map from CNS/XPLOR (The map file
name should include the .xplor extension)
1w2i_nowat.pdb
-The water and ligand molecules from 1w2i.pdb have been removed (for
electrostatics calculation). Since PH Acylphosphatase exists as a
monomer in solution, only chain A is included.
apbs.in - the template APBS input file for electrostatics calculation
pymol.dx - the calculated electrostatics map
PyMOL can be download from http://pymol.sourceforge.net/
Remember, if you make figures for publication, please remember to cite:
DeLano, W.L. The PyMOL Molecular Graphics System (2002)
DeLano Scientific, San Carlos, CA, USA.
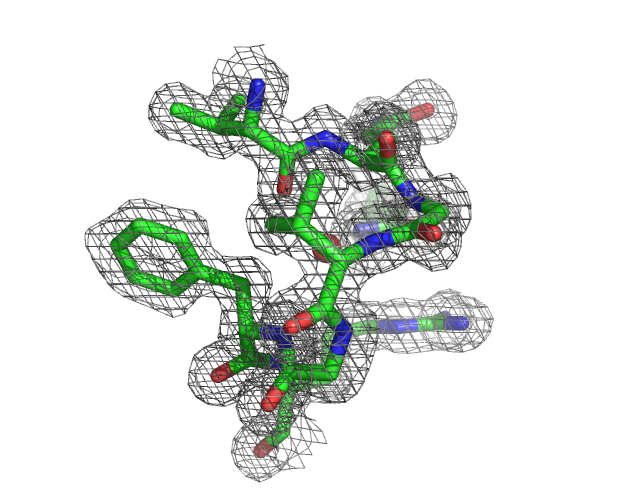
1. Figure showing Electron Density Map
You will be able to generate the following figure after this tutorial:
1. Loading PDB file
File -> Open -> 1w2i.pdb
2. Load the map file
File -> Open -> 2fofc.map.xplor
It takes a while to load the map file.
3. Zoom in the active site
PyMOL> select active, (resi 14-20,38) and chain A
PyMOL> zoom active
PyMOL> hide all
PyMOL> show stick, active
4. Locate and Display the active site water
We know that the amide group of Asn38 is h-bond to an active water.
PyMOL> select active_water, ( (resi 38 and name ND2 and chain A)
around 3.5) and (resn HOH)
The above command select any water molecules that is/are around 3.5A of
the ND2 atom of resi 38 in chain A
PyMOL> show spheres, active_water
Well the Oxygen atom is now shown in its vdw radius. We can reduce the
size of the sphere to 0.5A by:
PyMOL> alter active_water, vdw=0.5
PyMOL> rebuild
5. Display the electron density around the active site atoms at sigma
level=1.0
PyMOL> isomesh mesh1, 2fofc.map, 1.0, (resi 14-20,38 and chain A),
carve=1.6
Because the residue atoms were previously defined as "active", you
can simply type:
PyMOL> isomesh mesh1, 2fofc.map, 1.0, active, carve=1.6
6. You can change the color of the map by:
PyMOL> color grey, mesh1
7. Normally you want to set the background color to white for
publication
PyMOL> bg_color white
8. Publication quality figures
To render a figure with the default resolution (640x480)
PyMOL> ray
You will be able to preview the low resolution figures on screen. If
you have done everything right, you should be able to see this:
To render a figure with high resolution
PyMOL> ray 2400,2400
Well, it takes a while to produce it. Then you can save the figures in
PNG by
File -> Save Image
9. You can save the session by:
File -> Save Session
The saved session will be a .pse extension. You can reload it by
double-click the .pse file in Windows.
2. Cartoon representation and surface
You will be able to generate the following figures after this tutorial:
1. Load the PDB file
File -> Open -> 1w2i.pdb
2. Hide everything and then show protein cartton
PyMOL> hide everything, all
PyMOL> show cartoon, all
3. Color the helix, sheet, and loop
PyMOL> color purple, ss h
PyMOL> color yellow, ss s
PyMOL> color green, ss ""
4. Color chain A and B
PyMOL> color red, chain A
PyMOL> color blue, chain B
5. Create a surface display for chain A
PyMOL> create obj_a, chain A
PyMOL> show surface, obj_a
You can set the surface to be partially transparent.
PyMOL> set transparency=0.5
PyMOL> set transpareny=0.1
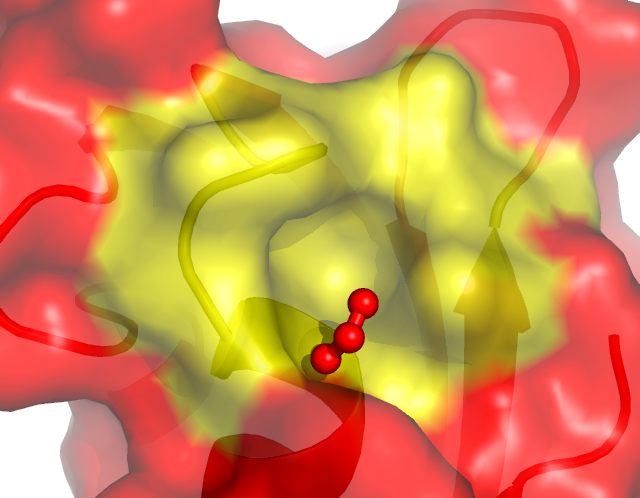
6. Color the active site residue
PyMOL> select active, (resi 14-20,38 and chain A)
PyMOL> color yellow, active
Try to rotate the molecule. Do you see a hole around the yellow
surface? That's the active site craddle for binding phosphate.
If you haven't rotated the molecule, you can rotate it using the
following commands to get a better view of the cradle:
PyMOL> turn y, -60; turn x, -20
PyMOL> zoom active
7. Locate and display the bound formate ion in the active site.
PyMOL> select ligand, active around 3.5 and resn FMT
PyMOL> show sticks, ligand
PyMOL> show spheres, ligand
PyMOL> alter ligand, vdw=0.5
PyMOL> rebuild
PyMOL> set transparency=0.25
8. Rendering and output
PyMOL> bg_color white
PyMOL> ray
File -> Save Image
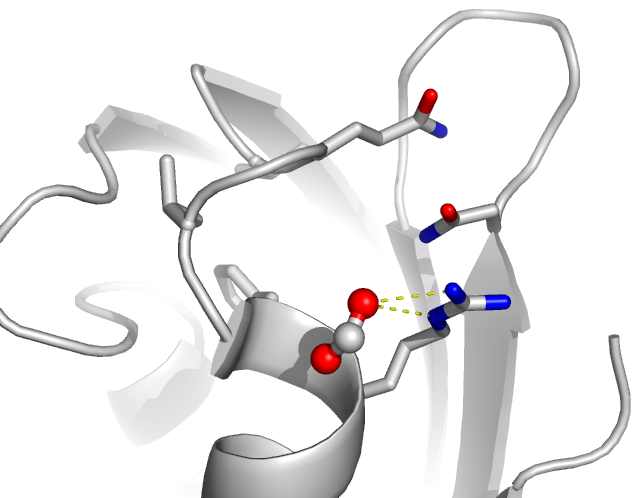
9. Display the side-chain of active site residues on top of the
cartoon representation
PyMOL> hide surface
PyMOL> select sidechain, not (name c+n+o)
PyMOL> show sticks, (active and sidechain)
PyMOL> color blue, name n*
PyMOL> color red, name o*
PyMOL> color white, name c*
10. Display and measure distances
Wizard -> Measurement -> Distance
Click two atoms to obtain the distance between these two atoms clicked.
Use this to measure the distance between the arginine N atoms and the
oxygen atoms of formate ion.
When you are finished, press the 'Done' button
You can also measure the distance between two atoms by:
PyMOL> distance resi 20 and name NH2 and chain A, resi 1092 and name
O2 and chain A
You can hide the distance label by
PyMOL> hide labels
11. create the figure
PyMOL> ray
File -> Save Image
3. Using APBS and PyMOL to display the electrostatics surface
You will be able to generate the following figure after this tutorial:
You need to remove the water and ligands molecule from 1w2i.pdb.
1w2i_nowat.pdb
-The water and ligand molecules from 1w2i.pdb have been removed (for
electrostatics calculation). Since PH Acylphosphatase exists as a
monomer in solution, only chain A is included.
apbs.in - the template APBS input file for electrostatics calculation
pymol.dx - the calculated electrostatics map
A. Using APBS to calculate the
electrostatics map
We assume you have install APBS
and PDB2PQR in a linux
machine.
1. Use PDB2PQR to convert the PDB format to PQR format
> pdb2pqr.py --ff=amber --apbs-in 1w2i_nowat.pdb pymol.pqr
The PQR file will be output to pymol.pqr.
2. Use psize.py to determine the grid dimensions for APBS calculation
> psize.py pymol.pqr
You should be able to see the following results:
Center = 37.468 x 31.798 x 12.177 A
:
:
Coarse grid dims = 53.011 x
58.568 x 65.807 A
Fine grid dims = 51.183 x 54.452
x 58.710 A
Num. fine grid pts. = 97 x 97 x 97
Take a note on these parameters.
3. Edit the apbs.in
You need to enter the following parameters:
cgcent 37.468 31.798
12.177 #
Grid Center
fgcent 37.468 31.798
12.177 #
Grid Center
cglen 53.011 58.568
65.807 # coarse
mesh lengths (A)
fglen 51.183 54.452
58.710 # fine
mesh lengths (A)
dime 97 97
97 #
Grid Points
4. Run APBS
> apbs apbs.in
After a while, it will create an electrostatics map called "pymol.dx".
B. Using PyMOL to visualize the
electrostatics map
1. Open the PDB and the pymol.dx files.
File -> Open -> 1w2i_nowat.pdb
File -> Open -> pymol.dx
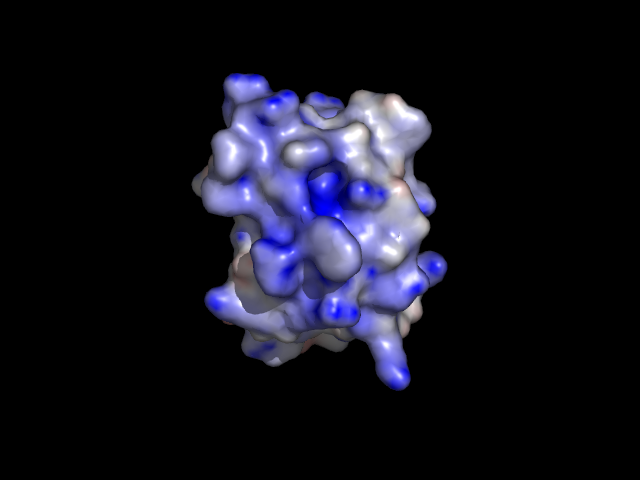
2. Display the electrostatics surface
Plugin -> APBS Tools -> Visualization
Press the "Show" Button in the Molecular Surface menu.
The default setting is: Blue surface: +1 kT Red surface:
-1 kT
Now change the default setting to -10 and +10, and press the "Show"
button again.
Can you find a craddle with blue surface
(i.e. positively charged) on the protein molecule? That's is the active
site of PH acylphosphatase that binds a negatively charged substrate.
4. Create a series of PNG files for animated GIF movie
1. Setting up the movie
File->Open->1w2i_nowat.pdb
PyMOL> orient
PyMOL> hide everything, all
PyMOL> show cartoon, all
PyMOL> color purple, ss h; color yellow, ss s; color
green, ss ""
PyMOL> mset 1 x60
This command creates a movie with 60 frames
PyMOL> util.mrock 1,60,180
This command rocks the protein molecule +/- 180 degree in 60 frames
PyMOL> mplay
This command plays the movie
2. Now try this:
PyMOL> util.mroll 1,60
This command rotates the protein molecule 360 deg in 60 frames
Type "mstop" to stop the animation
3. Saving frames in PNG format
PyMOL> mpng frame
This will create frame0001.png frame0002.png, etc ...
If you want ray-traced rendering for all the frames, you can:
PyMOL> set ray_trace_frames=1
PyMOL> mpng frame
Very good quality animation but very slow to produce all the PNG files!!
4. You can convert these PNG files in a batch to GIF using the program XnView, and then combine these GIF
files to create an animated GIF using UnFREEz:
5. Structural alignment of two homologous proteins
In this tutorial, you are going to align PH acylphosphatase and bovine
acylphosphatase (2ACY.pdb)
File -> Open -> 1w2i_nowat.pdb
File -> Open -> 2ACY.pdb
PyMOL> align 1w2i_nowat, 2ACY
You should see the following in the text window:
ExecutiveAlign: 446 atoms
aligned.
ExecutiveRMS: 23 atoms
rejected during cycle 1 (RMS=0.86).
ExecutiveRMS: 20 atoms
rejected during cycle 2 (RMS=0.63).
Executive: RMS
= 0.541 (403 to 403 atoms)
In this case, the RMSD is 0.541 A.
More often, people will report Ca RMSD values, which can be determined
by:
PyMOL> align 1w2i_nowat and name ca, 2ACY and name ca, cycles=0